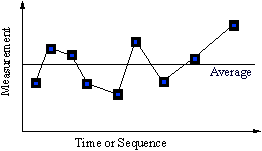
Run Chart
Purpose
To monitor a process by determining whether or not the long range average is changing.
Guidelines
- Points are plotted on the graph in the order that they became available. It is common to graph the results of a process such as number of activities , errors, or productivity as they vary over time. (Hint: Focus only on what is important, ie. the vital changes, not every variance is important.)
- Look for meaningful trends or shifts in the average. We expect to see equal numbers of points on either side of the average, but it becomes relevant if significantly more points lie on one side of the average. An example would be if 10 points "run" on one side of the average, then a statistically unusual event has occurred and the average has changed.
- Changes that follow trends should be investigated to identify the cause of the change. If the change is favorable then the cause should become a permanent part of the system/process. However, if the change is unfavorable, then the cause should be eliminated.
- An increase or decrease of at least six points with no reversals would not happen randomly and thus needs to be investigated.

(click on the image to take you home)


