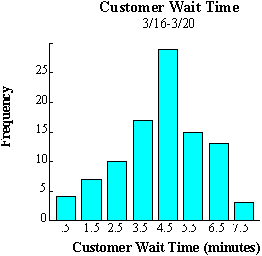

A histogram takes measurement data, e.g. average waiting time or response time, and displays its distribution. A histogram reveals the amount of variation within any process.
A histogram is a vertical bar graph that shows the nature and distribution of data. The team can use histograms to identify problems and opportunities for improvements; to compare one process (or group, department, etc.) to another; and/or to measure if the process conforms to a certain standard. A histogram shows the information from a check sheet in visual form.

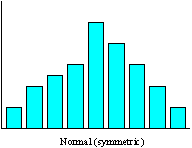
This shape occurs most often. Most of the occurrences are in the center with about an equal number on each side. This shape is the result of a normal, in control process.
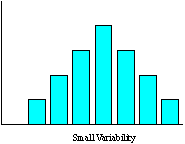
A normal distribution with small variability suggests that the process is probably operating within specification limits. Measures are tightly grouped around the center.
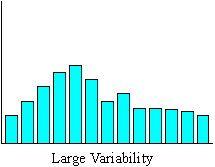
A normal distribution with with large variability suggests that the process is probably operating outside of specification limits. Measures are spread out from the center.
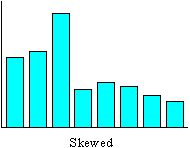
A skewed distribution indicates that the process is operating near an imposed limit.
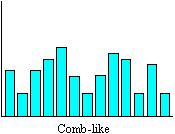
The comb-like distribution may be the result of a measurement error (for example, if more than one person is recording the data or more than one instrument is used). Additional data collection may be necessary.
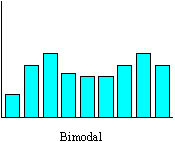
The bimodal distribution may be the result of measuring two or more processes with different averages together. It may be necessary to separate the data and draw a histogram for each process.
(click on the image to take you home)